

How to get values of a raster layer in QGIS
How to get values of a raster layer in QGIS ,To get the values of a raster layer in QGIS, you can use the "Identify Features" tool.
Contents
How to get values of a raster layer in QGIS
This article cartogeek.com shows a short tutorial on how to get values of a raster layer in QGIS. It is a simple and easy process, which in QGIS requires the use of plugin Point Sampling Tool.
On multiple occasions it is necessary to know the values that a raster layer has in specific locations of a territory. It is usual to require the obtaining the values of a digital terrain model ( MDT, MDE or DEM ) or in layers showing environmental variables continuous ( temperature, humidity, precipitation … ) over a certain area.

While we can easily query the value of any cell in a raster layer with the query tool of any desktop GIS, it is very likely that at some point it will be necessary to store that information in another layer.
That new layer of points will store the sampling values obtained from the raster layer. Later we can easily operate with it.
How to extract the values of a raster from QGIS
Get the values of a raster layer it is a simple task to do with QGIS and the help of the so-called plugin Point Sampling Tool, developed and maintained by Borys Jurgiel.

This plugin, available in the QGIS plugin repository, is specifically designed for extract the values of the cells of a raster layer from a layer of points.
Points, as sampling locations, will serve as the input layer to Point Sampling Tool to operate on the raster and extract the values.
Point Sampling Tool in QGIS
Point Sampling Tool allows storing in a new layer the values of the raster cells of one or multiple layers on which each of the points are located.
In addition to working with raster layers, this plugin also allows you to operate with vector layers to extract its values. If we have polygon-type vector layers loaded in the project, the values stored in any of its fields can also be obtained.
To use Point Sampling Tool and get the raster layer values we will need to have a stored point type layer. Although it is possible, it is recommended to dispense with temporal layers and involve them in geoprocesses.
Important: for the correct operation of this specific plugin, it is essential to ensure that all layers involved in the analysis are properly projected in the same Coordinate Reference System ( SRC ) and not projected “ on the fly ”.
Otherwise, Point Sampling Tool will return a null or erroneous value by not being able to cross the locations correctly with the desired raster cells.
Using Point Sampling Tool to get values from a raster
In this case, by way of example, we will extract the elevation values of a series of arbitrary locations from a digital lift model from Sicily and a layer with the sampling points.
Once the dot layer is loaded, the ( s ) layer ( s ) raster and the Point Sampling Tool plugin is installed, we will access the tool form from the plugins menu.

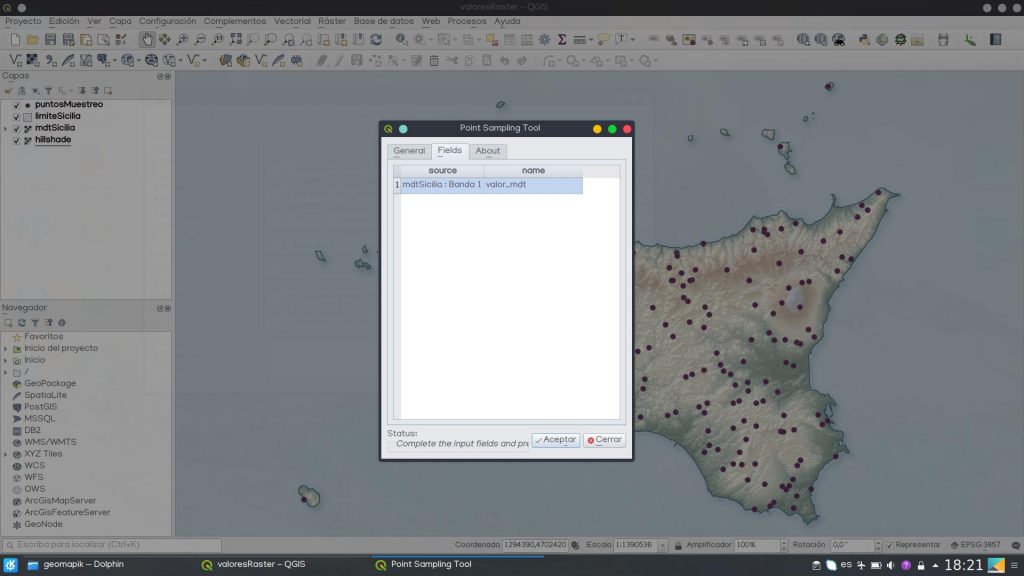
When you open Point Sampling Tool, a form is displayed to fill. In it, we must specify the following:
- In first the layer containing the points for the sampling loaded in our QGIS project
- In second place, the layer or raster layers from which we want to obtain the cell values. In case you want to operate on vector layers of type polygon the specific fields from which to extract must be selected information.
- Finally, a path and file name must be specified, in which Point Sampling Tool will store the values obtained from the layers involved in the analysis.

If we want to modify the characteristics of storage of information in the output layer, from the fields tab ( fields ) we can alter the output name of the layer attributes.

In our case, just crossing the dotted layer with the raster layer of MDT the output file will have a single field with information. We rename it to “ value_mdt ”.
Once everything is duly modified we will proceed to run the tool.
The result will be another layer of points, where each of points contains the value of the cell of the raster at the specified locations using the other dot layer.
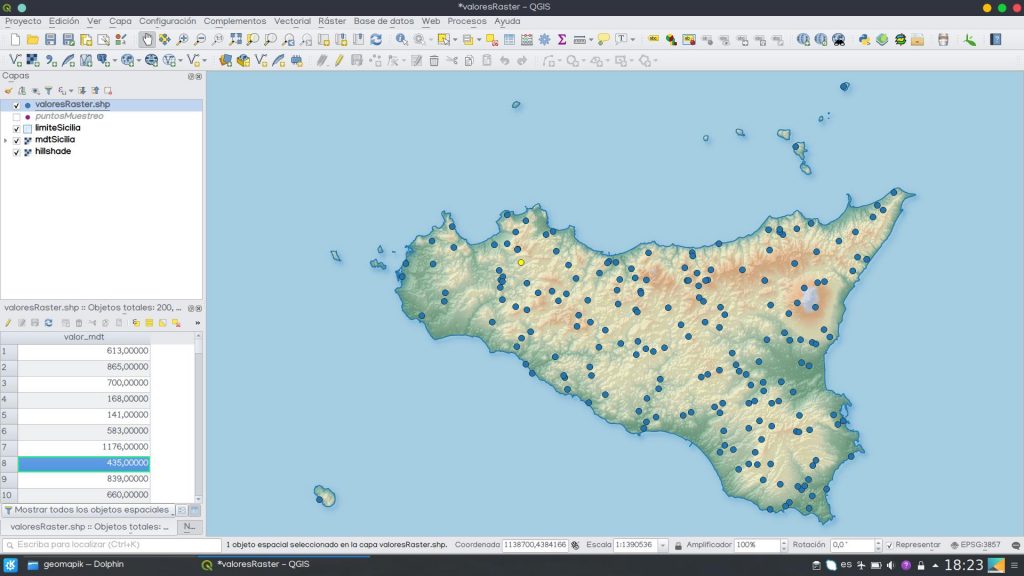
Consulting the attribute table we can visualize and consult the extracted values corresponding to each location of the sampling carried out, as well as visualize the values through a simple labeling of the generated layer.

Read More