Spatial interpolation in QGIS – methods, processes and evaluation
Spatial interpolation in QGIS is a process of estimating unknown values at unsampled locations based on known values at sampled locations. There are various methods available for spatial interpolation in QGIS, including inverse distance weighting, kriging, spline interpolation, and others
Contents
Spatial interpolation in QGIS
The spatial interpolation it is a crucial process in multiple fields of work and research. By working with GIS and having to evaluate variables with a spatial component, performing any type of spatial interpolation correctly is critical to the quality of the study.
This article focuses on defining what is spatial interpolation, than methods they exist, how they are classified and which are the most appropriate. In addition, different available methods of spatial interpolation in QGIS to compare the results, using as an example a set of climatic data. Spatial interpolation in QGIS
What is spatial interpolation?
Usually considered spatial interpolation as an integral part of the field of geostatistics. Spatial interpolation is based on the calculation or estimation of unknown values of a spatial variable from other values whose value is known.

The spatial interpolation processes they are valid for any continuous environmental variable on a specific territory. As examples we can find variables of temperature, humidity, precipitation, pressure, noise pollution, light pollution…
The climatic variables they are the most frequently required of this kind of analysis. In these cases, spatial interpolation is crucial since there are no infinite meteorological stations that allow knowing the exact temperature value, humidity or precipitation on each and every point of a territory.
Spatial interpolation processes are carried out to estimate the intermediate values between measurement points. The measurement values of the station network are used and a calculation of the value is made for the rest of the territory.
The result obtained through the interpolation process is usually called a statistical surface. It is, therefore, a continuous surface with values interpolated from others previously known.
Classification of interpolation methods space
Despite all spatial interpolation methods they have the same basic principle, not all methods work the same or accept the same premises, being able to return very different results according to their own characteristics.
The classification of interpolation methods can be done based on multiple criteria. Thus, we could speak of interpolation methods:
- Global or local, depending on whether they use all the values of the evaluated area or only a part of it ( subset ).
- Gradual or abrupt, depending on the continuity and softness of the resulting surface.
- Exact or approximate, depending on whether they respect the exact input measurement values for interpolation or whether, on the contrary, they can be altered or smoothed to fit the model of the set.
- Univariates or multivariates, depending on whether or not they admit values of multiple input variables to generate the model and the interpolation surface. In GIS, distance is generally the supported variable for univariate interpolation methods.
- Deterministic or stochastic, depending on whether or not they incorporate random variations ( uncertainty ) on the interpolated surface. Deterministic methods are applicable when there are sufficient measurements to describe it mathematically, while stochastics incorporate the concept of randomness due to insufficient measurements.
Spatial interpolation in QGIS
Methods for spatial interpolation in QGIS
The possibilities in terms of methods of interpolation in QGIS they are quite broad, although mostly belonging to the group of deterministic methods defined above.
Also in QGIS we can adapt each of the methods and adjust your parameters according to the needs when carrying out the geoprocess to generate the interpolation layers based on our points with measurement values.
The main interpolation methods Possible gathered in the different libraries from which this desktop GIS is nourished are the following.
Nearest neighbor ( Nearest Neighbor )
The interpolation through the closest neighbor method it is based on the generation of Voronoi polygons. The Voronoi polygons they constitute the most basic and simple method of vector interpolation. The method is based solely on Euclidean distance, bypassing any type of value assigned to the sampling points.

East interpolation method allows dividing the space into equivalent areas of domain or influence for each of the input measurement points. The Voronoi or Thiessen polygons they are defined by lines that delimit the region belonging to the closest point. The perimeter of each of the generated regions is equidistant from all neighboring points
Finally, the method assigns each polygon the value of the point it contains and from which it was generated. Being a distance-based method, interpolated variables can be both qualitative and quantitative.
This method is useful, for example, in studies of geomarketing to know possible areas of influence, or to carry out regionalizations or territorial divisions proportional.
TIN ( Triangulated Irregular Network )
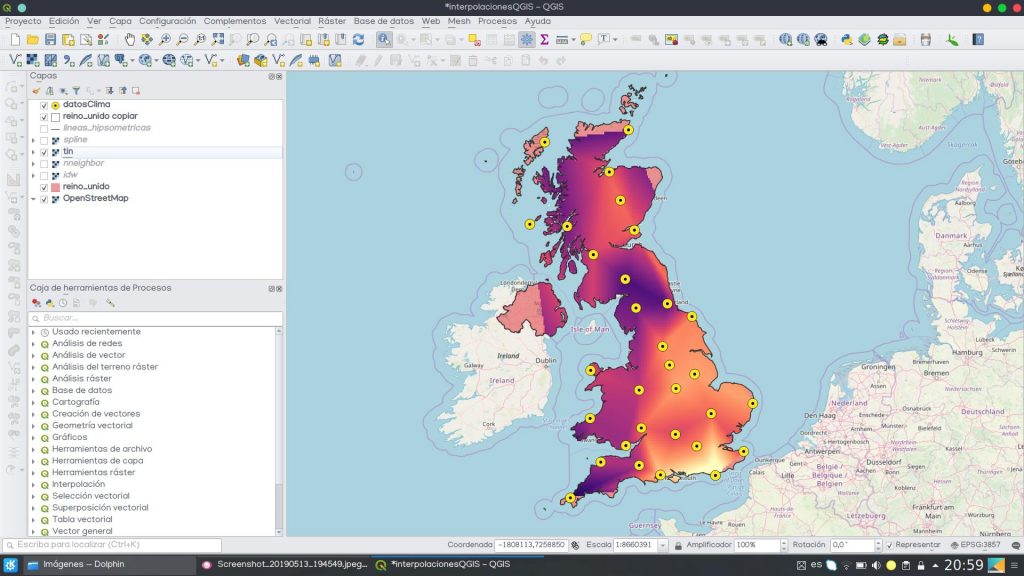
East interpolation method returns a surface of triangles formed from the location of a series of vertices whose values are known. The vertices are connected by edges to generate said triangular network.

The result obtained, the TIN surface, is a mesh or network of interconnected triangles, where each of them represents a homogeneous zone as far as the studied variable is concerned. The TIN method will therefore try to generate a set of triangles over space that maximize the area / perimeter ratio.
Its use is very common, especially for terrain models based on known elevation measurements, although it can be applied to other quantitative measurements of different environmental variables.
IDW interpolation ( Inverse Distance Weighting )
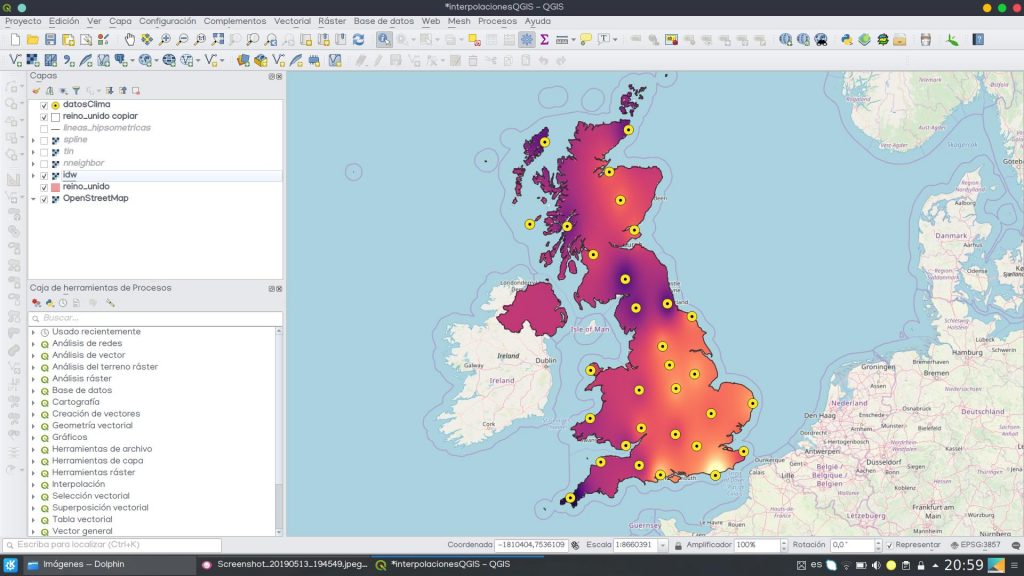
Through the IDW interpolation method sampling points will be weighted during interpolation. In this way, the influence from one point in relation to others it is reduced or decreased as the distance between them increases.

In the interpolation method IDW a power value can be set, called coefficient P distance which by default is 2. The higher the P value, the greater the emphasis or weight assigned to the nearby points to be evaluated, resulting in a more abrupt statistical surface. The lower the P value, the greater the emphasis in the whole sample of values, resulting in smoother surfaces.
Generally used in interpolation processes where the data set available for interpolation is abundant, it is distributed homogeneously throughout the space and there are no great distances between its locations.
Spline interpolation
The Spline tool uses an interpolation method that estimates values using a polynomial function that minimizes the general curvature of the surface, resulting in a smooth surface that passes exactly through the entry points.

As we said before in the classification section, this method, together with Kriging, is one of the exact interpolation methods existing that does not support approximations or smoothing of the input values.
Mathematically, the tool Splines It uses different polynomial functions plus chords for each section, thus adapting to a softer, less abrupt and uniform surface.
How to perform a QGIS interpolation to from a dot layer
All interpolation methods available in QGIS They belong to the various libraries that it brings installed by default: GDAL, GRASS and SAGA.
The interpolation geoprocesses used in this article for each of the methods, together with the parameters specified in the images, are the following:
- Nearest Neighbor Method: GDAL library ( closest neighbor )
- IDW method: IDW interpolation from the QGIS library.
- TIN method: TIN interpolation from the QGIS library.
- Spline method: v.surf.bspline from GRASS bookstore
To run any of these geoprocesses interpolation we can look for them directly in the toolbox geoprocesses.

Each of the QGIS interpolation methods has its own form unique for specifying input and output layers, as well as a whole series of parameters to configure to adapt the model.

You can download the data here Climatic used in this article to perform interpolation tests with the different stored variables. In the case of this article, we have worked on interpolation with the variable of hours of sunlight in the United Kingdom.
This is a set of average values of precipitation, temperatures and hours of sunshine in a specific month recorded in the main UK weather stations. The data has been obtained from the MetOffice State Meteorological Agency.
How to choose the best interpolation method in QGIS?
The choice of interpolation method more appropriate will depend on the very nature of the sampling data set that we want to interpolate.
So we should know in advance:
- Type of variable to interpolate: quantitative or qualitative and the logic or need to apply each method for each type of variable.
- Statistical characteristics of the sample: maximum, minimum, mean and median values, standard deviation … You can consult the following article to find out how to perform an exploratory statistical analysis with QGIS.
- Spatial distribution of the variables: spatial homogeneity of the samplings, average distance between sampling points…
- Existence of abnormal values, clusters and hotspots or coldspots that can infer or alter the interpolation surface.
Evaluation of the method and estimation of interpolation error
Subsequently it will be very useful to carry out an evaluation of the method and the error obtained in interpolation.
Could be done by, by example, the comparison of certain real values subtracted from the sample with the estimated values obtained by interpolation in those same points.
Subsequently, the configuration of the method parameters to bring the model as close as possible possible at actual measurement values.
Read More


