What is Goolzom – Cadastre Viewer and how does it work?
What is Goolzom: the advanced cadastre Viewer and how does it work?
Contents
- 1 The Importance of Goolzoom and Cadastre
- 2 What is Goolzoom?
- 3 About Goolzoom’s development
- 4 How does Goolzoom work?
- 5 Goolzoom: the viewfinder to consult plots of the Cadastre
- 6 Goolzoom PRO Cadastre Tool
- 7 Consult the real estate market with Goolzoom
- 8 Other interesting Goolzoom tools
What is Goolzom: the Advanced Cadastre Viewer and how does it work?
This article aims to carry out an in-depth analysis of Goolzoom as an access tool to Cadastre for consulting information related to cadastral plots.
The focus of the entrance is focused on the analysis of the advantages of its use and on describing the entire range of functionalities of the Cadastre viewer, both the query and download options, as well as the advanced analysis functions that Goolzoom makes available to users.
The Importance of Goolzoom and Cadastre
When we talk about spatial information, it is important to value both its quality and access to it. With the Goolzoom cadastre viewer, access to cadastral information it is made much easier than through the usual search through the official website of the cadastre.
The information of the cadastral map It is highly relevant for many reasons, both for the administration or the institutions and for the technician who must access it. Even the citizen himself may require such information to know the limits of his properties or the surface they occupy.
Based on Cadastre valuations and appraisals of properties and real estate are obtained, ensures greater legal certainty for owners and also serves to prevent fraud in this sector.
In this sense, access to the cadastre consultation it is a critical requirement for the work of many professionals in their day to day, whether they carry out tasks related to the GIS world or, of course, are dedicated to the real estate business, architecture, urban planning or related professions.
What is Goolzoom?
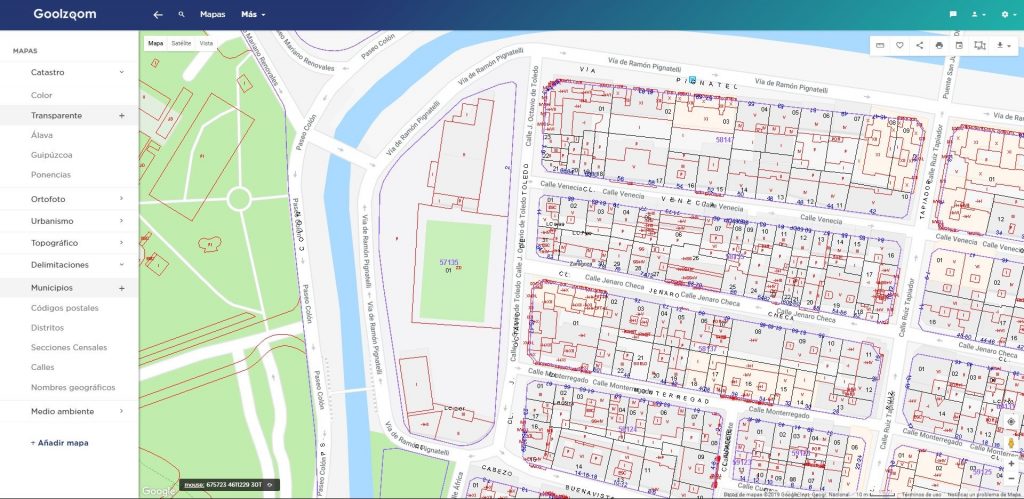
Goolzoom is a complete cartographic web viewer that allows consulting the plots of the cadastral map in addition to a multitude of layers of different themes displayed on a base map.
The viewer of the cadastre of Goolzoom displays the information of the cadastral map in order to be able to inspect, interact and access cadastral data of millions of plots, buildings and buildings throughout Spain.
As for thematic layers, we could basically differentiate 3 large types of information available on request:
- Information on all the plots of the cadastral map
- Urban planning, land uses and administrative limits
- Environment ( protected areas, flood areas … )
In addition, since the last update, data regarding:
- Availability for the purchase and sale of real estate in real estate portals
- Housing: prices, mortgages, appraisals, real estate park and typology…
- Population and demography: register, demographic projections, income, unemployment…
- Information about the owner of a certain plot, premises or property ( on demand and at cost ).
- Companies: number of companies, commercial premises, number of employees…
About Goolzoom’s development
It was developed in 2006 and implemented the following year with the aim of facilitate data consultation open referring above all to cadastre and real estate sector.
The data shown, therefore, is in the public domain and does not belong to the development company itself, but is grouped, organize and show the public through this viewer. You can get more information about its development.
There are a large number of versions that have gradually incorporated improvements in the viewer’s user interface, as well as adding functionalities for consulting available data and layers.
How does Goolzoom work?
The viewfinder basically consists of two main menus ( upper and lateral ) and one secondary.
The top main menu allows you to jump from the query of territorial information organized in layers ( tab of map) to information referring to data from real estate offer ( tab of real estate) .
Finally, it allows access to the statistical housing information, soil, population and companies ( tab of data).
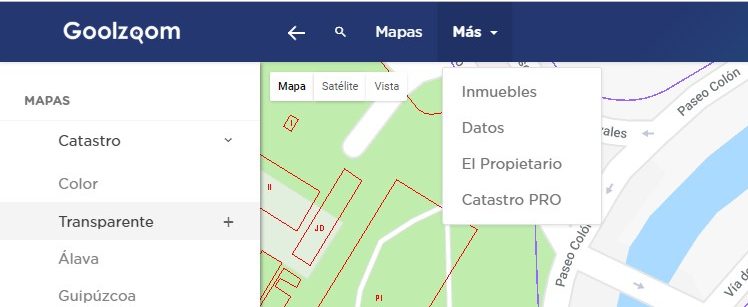
Additionally, two more options related to two extra tools are located in this same dropdown: The Owner and PRO Cadastre, which we will talk about and analyze later.
The magnifying glass symbol allows us to display a search bar to enter addresses concrete to look for and even the cadastral reference in case you know her. The viewer itself will take us to the entered address and we can then start the desired query.

In this same top bar, on your far right, we will find three buttons. They are used to access and manage user accounts and display the display menu.
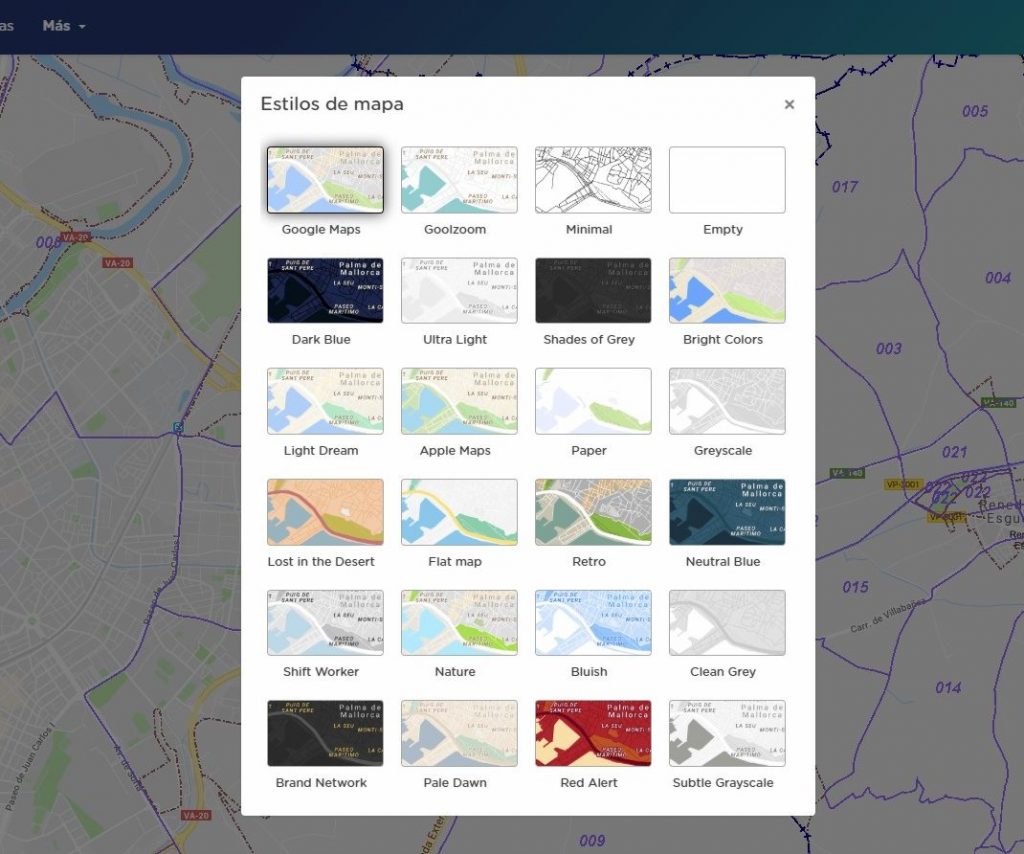
The default base map is that of Google Maps. However, we will be able to use the basic vector mapping of Goolzoom, as well as others depending on how it is more comfortable for us to visualize the information from other layers.
In addition, at the lower right end of the viewfinder we can find the Street View functionality of Google Maps to access the street view where we want. A very useful integrated tool to identify buildings, portals, access to plots…
On the other hand, the main lateral menu allows you to choose the layers or data to be displayed of each of the aforementioned tabs, both in the form of a layer and in the form of data.
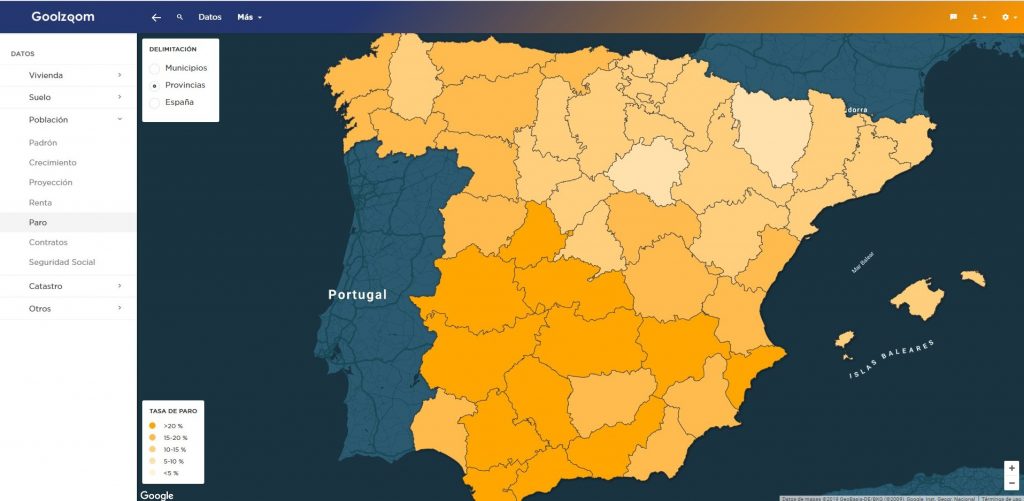
Most of these data, however, are also structured as layers. The information shown may be filtered according to administrative limits at multiple scales: municipalities, provinces, communities … Always accompanied by a legend for its interpretation.
Goolzoom: the viewfinder to consult plots of the Cadastre
Goolzoom is known above all for the ease in consulting cadastral map information. As we say, it is a tool for accessing public data from the Cadastre, improving in any case the navigation and the ease of use and access to information of all the cadastral plots.
To perform any Query of the Cadastre from the viewfinder you just need to click on the plot to be consulted, having activated the layer « Cadastre » or « Transparent catastro ».
Then a sidebar will automatically unfold with the cadastral reference of the plot previously selected.
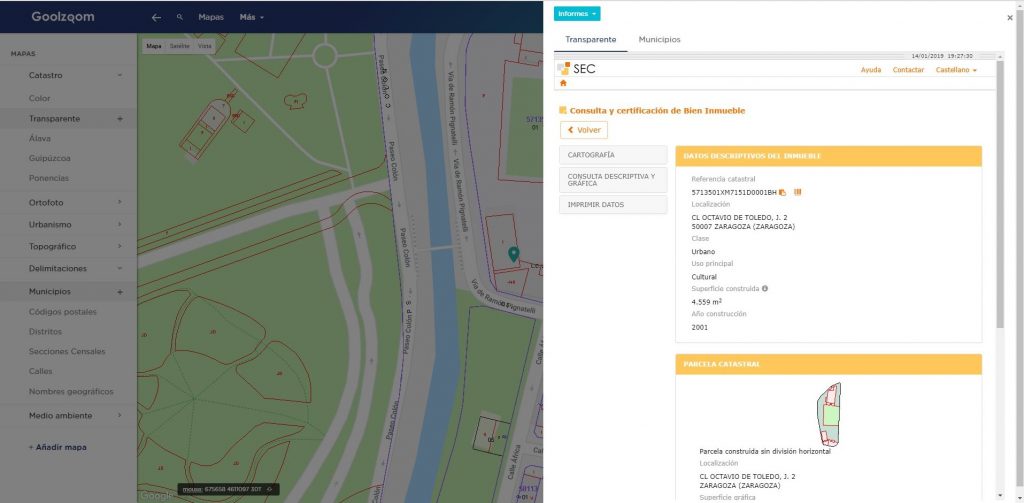
Clicking again on the reference links to the information from the Cadastre Headquarters file and the information regarding the plot is displayed.
In case there are different properties on the same plot, the available cadastral references will appear.
From the file of each plot you can consult the cartography of the same, the data regarding real estate of the plot, class and land use of the plot, year of construction, size of the property and plot surface, among other data.
Likewise, the file and the location map of the plot can be downloaded or the selected property, as well as images of the facade or the environment if available. Alternatively, the Google Street View option may be helpful.
Goolzoom PRO Cadastre Tool
PRO Cadastre is a novel tool that includes the most advanced functionalities of this powerful viewer of the cadastral map. The PRO Cadastre viewer works slightly differently from other tools, although the appearance is very similar.
The tool Goolzoom PRO Cadastre seeks to facilitate and personalize the search for information linked to the cadastral map regarding plots, buildings and buildings.
The drop-down panel on the right side of the viewfinder contains two tabs: Cadastre and Analysis. The first of these focuses on the ordered visualization of multiple attributes and the second is aimed at performing density analysis for selected areas.
Display of attributes of plots, buildings and constructions
The Cadastre option allows displaying different attributes for each of the possible elements mentioned above.
Thus, for example, in the case of plots we can visualize:
If it is rural or urban plots
The total built area
Area built above ground
Built surface below ground
The covered surface

The Cadastre option allows you to display different attributes for each of the possible elements mentioned above.
Thus, for example, in the case of plots we can visualize:
- If it is rustic or urban plots
- The total built area
- Area built on grade
- Surface built under grade
- The covered surface

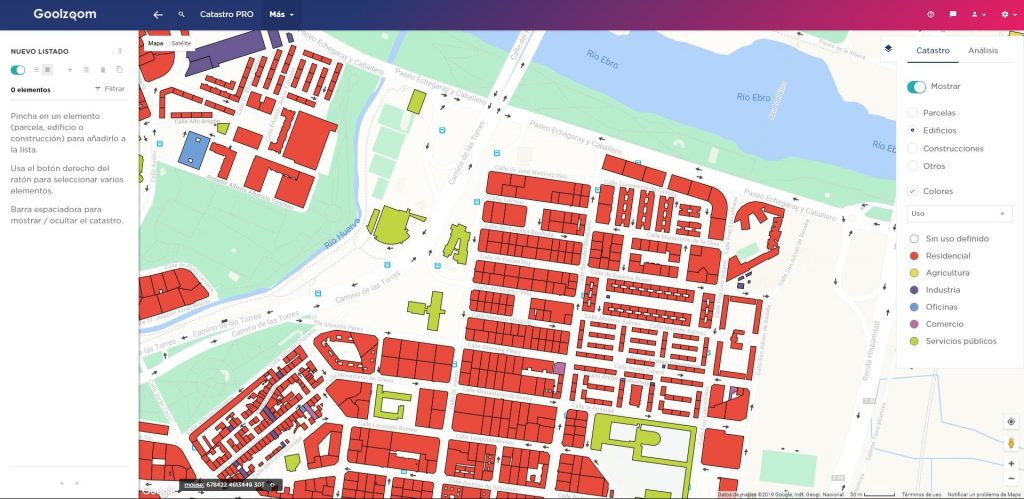
If you want to obtain information about the buildings, we can visualize the following options:
- Use for which the building is intended
- Built surface
- Conservation status
- Year of construction
- Number of constructions
- Number of dwellings
Finally, in the case of constructions, we will be able to filter and visualize information about:
- Plants on grade
- Plants under grade
- Low level height
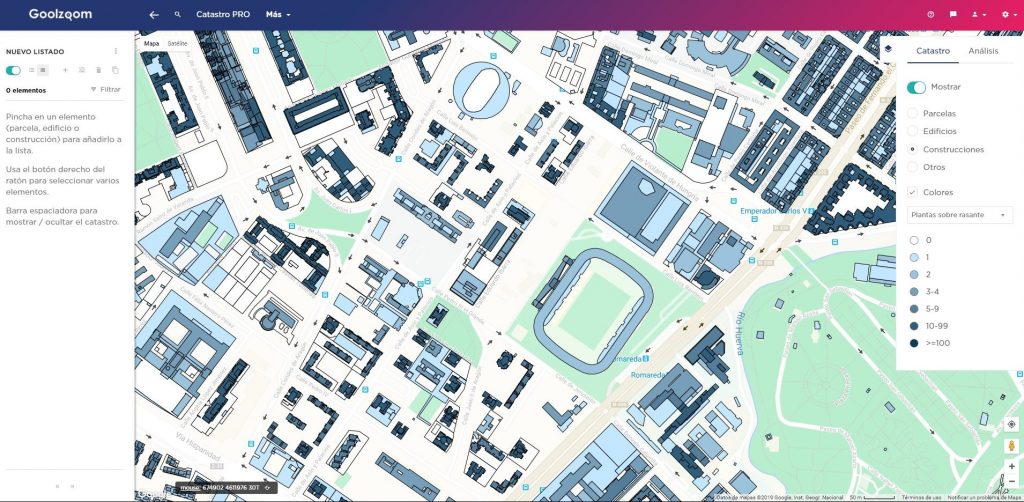
Basically the viewfinder allows show the attributes of different geometries possible that the Cadastre uses, granting values according to the legend displayed to be able to interpret it.
It is a very useful tool for obtain information visually without the need to consult plots individually, as well as to obtain information as a whole or to compare different areas of a municipality, an urbanization, a neighborhood, etc.
Consultation of densities and heat maps in Cadastre PRO
This second option will allow queries about the same attributes previously listed, but this time visualizing their spatial densities.
We can draw a polygon that frames the area to be analyzed and then ask that PRO Cadastre perform a heat map or of densities of the attribute that is of our interest.
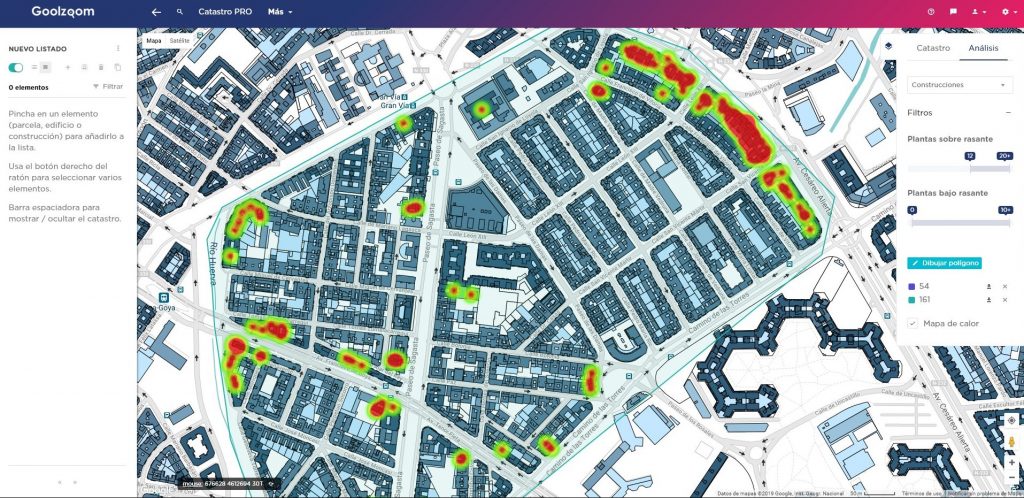
We can filter this same attribute, according to its characteristics. I mean, for plots we can filter, for example, the typology, its surface and its constructed surface. While for buildings We can filter the densities according to the building use and the year of construction of the property.
Practical example to create a heat map in Goolzoom
Suppose we want to make a query to visualize where the residential buildings built after 1990 in a neighborhood of a certain city are concentrated.
First of all we should select the area corresponding to the neighborhood in question through the polygon drawing tool. Next, we must select what we want consult information regarding buildings. Finally, we will select the residential type use and we will establish the construction range between the 1990s and today.

Likewise, we will be able to carry out and keep various queries simultaneously. To do this, we only have to draw another polygon with the same tool and it will automatically be added to the list of drawn polygons.
Different filters can be applied to each polygon and operate with different geometries. In this way, we will be able to activate the heat maps for all the polygons and thus strategically compare only those areas that are of interest to us, using the same or different geometries and query filters.
Save plots of the cadastre
Another of the options available in Goolzoom PRO Cadastre is geometry saving ( whether they are plots, buildings or constructions ) that have been selected.
Selection can be only left clicking on a certain geometry or multiple, selecting the required geometries with the right mouse button on them.
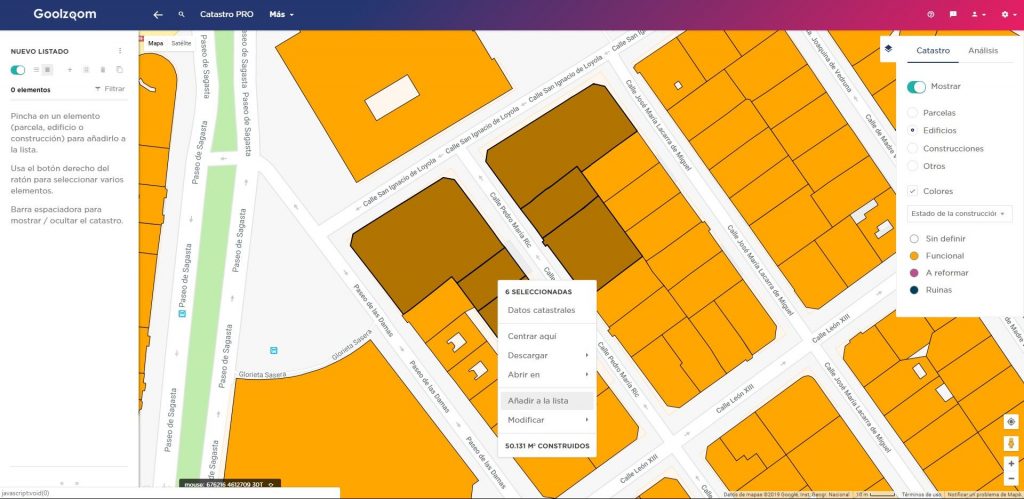
Once the plots, buildings or constructions are selected, we can add them to the list to save that selection.
For each of the geometries stored in the list, different operations may be carried out on them. With this selection in the list we will be able to filter the selection, know the details by accessing the link with the relevant cadastral information, make a description, etc.
In addition, we can alter geometry and modify its appearance as for style. Basically this PRO Cadastre option allows us save, visualize and customize the selected elements for better management according to our interests.

In addition, we can upload to Cadastre Pro our own cadastral references to add them to the list. To access that option, in the left Cadastre PRO menu we will click “ add items to the ” list.
Once the file is uploaded, Goolzoom will check the references with those of its Database to select the geometries that contain these cadastral references.
Suppose we have a huge listing of cadastral references of plots that we want to identify and select in order to operate with them.
With PRO Cadastre we should only upload the file containing that listing and we can quickly select them, save them in a list and have them identified in the viewer.
Likewise, in addition to the cadastral references, we can also upload files containing geometries. PRO Cadastre allows you to load geometries for a selected item from our computer to be able to view them in the viewer and edit them if necessary.
Disaster Geometry Download
With Catastro PRO we can also download the geometries that we select, both on the fly and if they are listed. Geometries involved in analysis within polygons may also be downloaded in different formats that Goolzoom makes available to user customers:
- Kml
- Gml
- Dxf
- GeoJson
- GeoCSV
- Image
- Xlsx ( data )
- Pdf ( data )
In this way, the geometries involved in the area of interest can be used to incorporate them into a Geographic Information System or in others AutoCAD type assisted drawing programs to carry out future analyzes or make plans of the area.
Consult the real estate market with Goolzoom
This new Goolzoom functionality is remarkably useful for compiling information from multiple real estate portals and show the information on the map of the viewer itself.
In fact, many of the web real estate portals have this feature, but Goolzoom starts from the advantage of integrating this information with another series of layers in addition to gathering information from multiple portals. To access this tool, it must be done from the top menu by doing click on the properties tab.
Regarding the use of this feature, it should be noted that we can filter the location of properties modulating the search range ( orange circle ). It can be done by moving the lens with the mouse itself or using the viewfinder zoom.
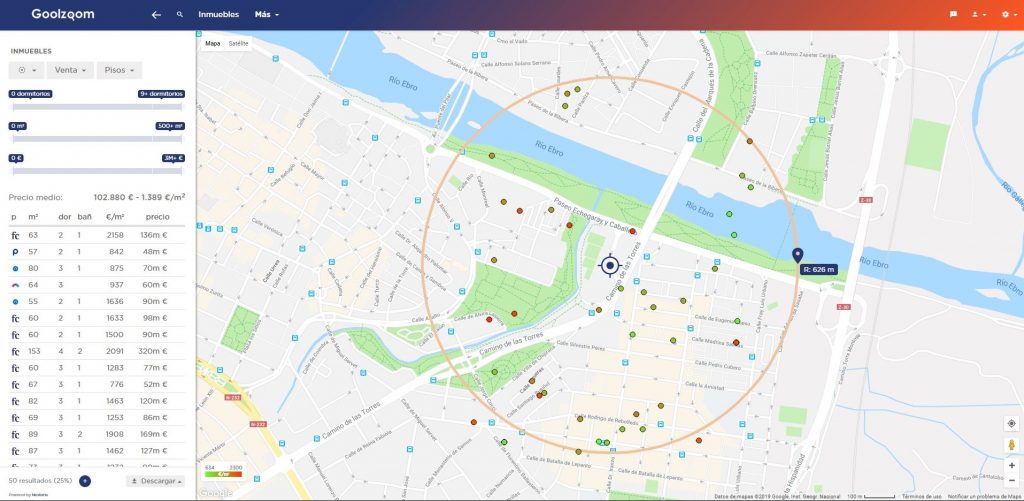
In this way we will filter spatially those properties that are of interest to us. In addition, the left menu itself that unfolds when searching allows us apply new filters for property characteristics such as price, bedrooms, sale or rental, etc.
Likewise, it will allow us to order the table that is displayed according to its own attributes, show more properties and even download the table itself in .pdf or .xls format for Excel.
In addition, we will be able to select each of the points that represent the properties contained in the search area or range, as well as know the details of each property when a pop-up window is displayed with the direct link to the website of the advertiser real estate portal.
Other interesting Goolzoom tools
Historical satellite images with Goolzoom
In this recent version, the possibility of using as a base cartography is also incorporated into the Goolzoom viewer historical satellite images.
It is a very useful functionality, since we can, for example, know the evolution of a specific area or a plot from the 1950s to the present day.
Thus, in the left side menu, under the cadastre option, all the orthophotographs available year by year appear.
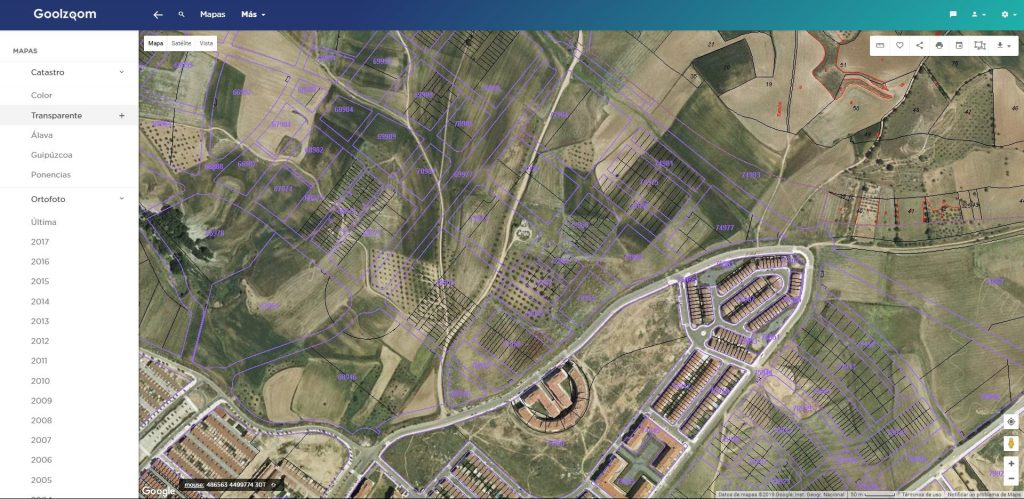
To satellite images we can apply transparency by clicking on the small button “ + ” located in the menu itself, next to each available orthophotography. If you do not locate an image for a specific year, we can click « Last » to show the viewer in the viewer most recent image possible.

Where the real interest lies is, above all, the overlay if you take into account that we can place the transparent cadastre layer on said satellite images to inspect changes on the ground, the evolution of housing, infrastructure constructions, etc.
Access to the historical cadastre from Goolzoom
In addition to viewing historical images, Goolzoom allows the possibility of accessing previous versions of the cadastral map.
To access this option, you must set the date to which you want to go back from the toolbar in the upper right corner of the main viewer.
In it, there is a calendar symbol that when you click, a pop-up window will be displayed where we will select the date on which you want to make the query.
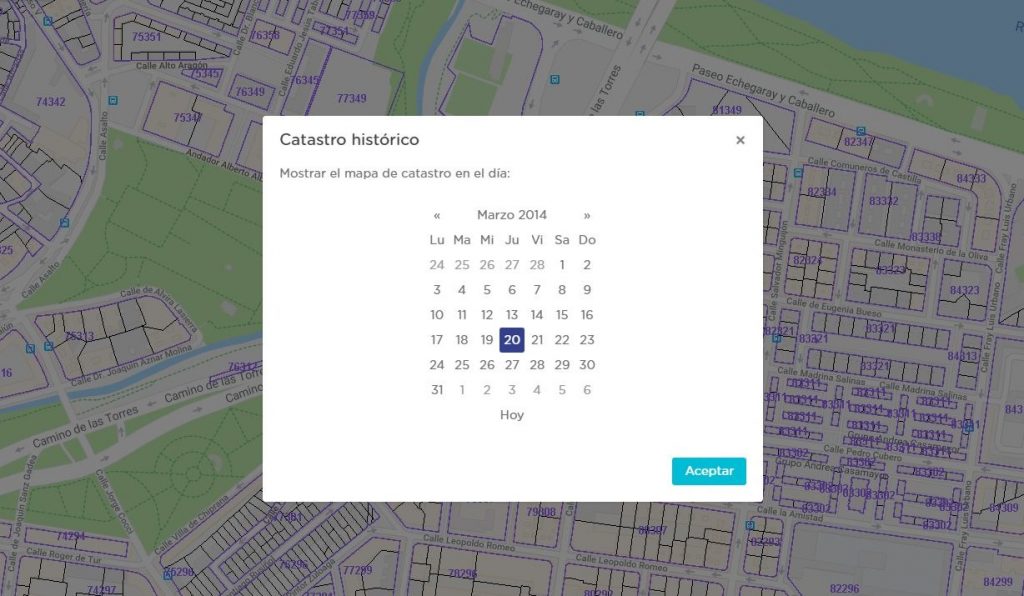
It is a useful option in case you want to refer to cadastral information on parcels and properties whose situation has been altered or its characteristics have changed over time.
Measurement of distances, areas and topographic profiles
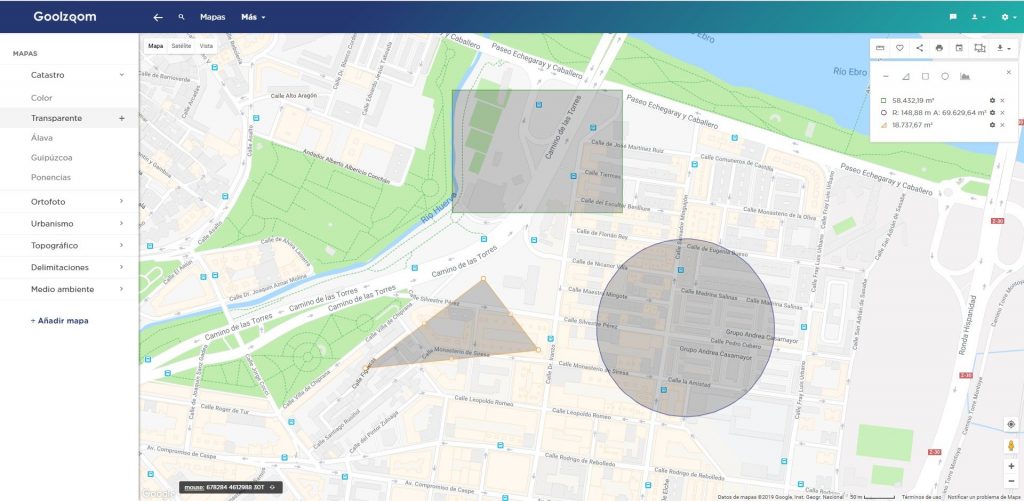
In addition to all this, Goolzoom allows measurements of distances and areas in different ways. We can access the measurement tools from the secondary menu in the upper right corner ( when we are in the maps tab ).
In this way, we can make linear measurement queries, draw polygons to know the determined area of a plot or group of plots, place a circle to measure areas, radii and perimeters and even know the topographic profile of a specific route ( useful, for example, to know the inclination of a street ).
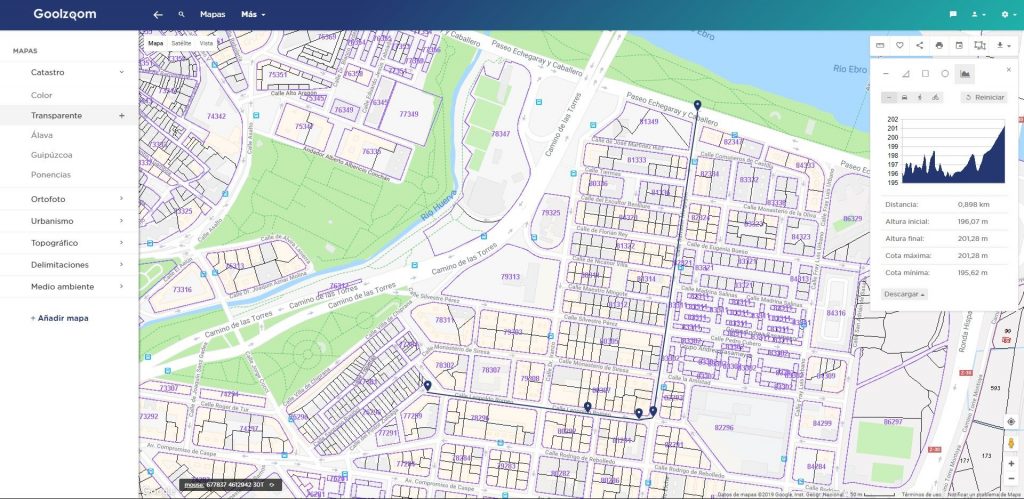
All the measurements we make will be saved under the measurement tools menu and will allow us to make comparisons or consult previous measurements.
Map view download in multiple formats
Goolzoom will also allow us to download layer information in various formats such as the following:
- KML ( For Google Earth )
- Image ( in png ) format
- Geotiff ( geo-referenced image )
- Dxf ( for CAD and GIS )
To access cartography downloads it can also be done from the secondary menu in the upper right corner.
The fact of being able to download information is very useful if you want to later incorporate it into a desktop Geographic Information System or carry out some type of analysis with said information a posteriori and outside Goolzoom.
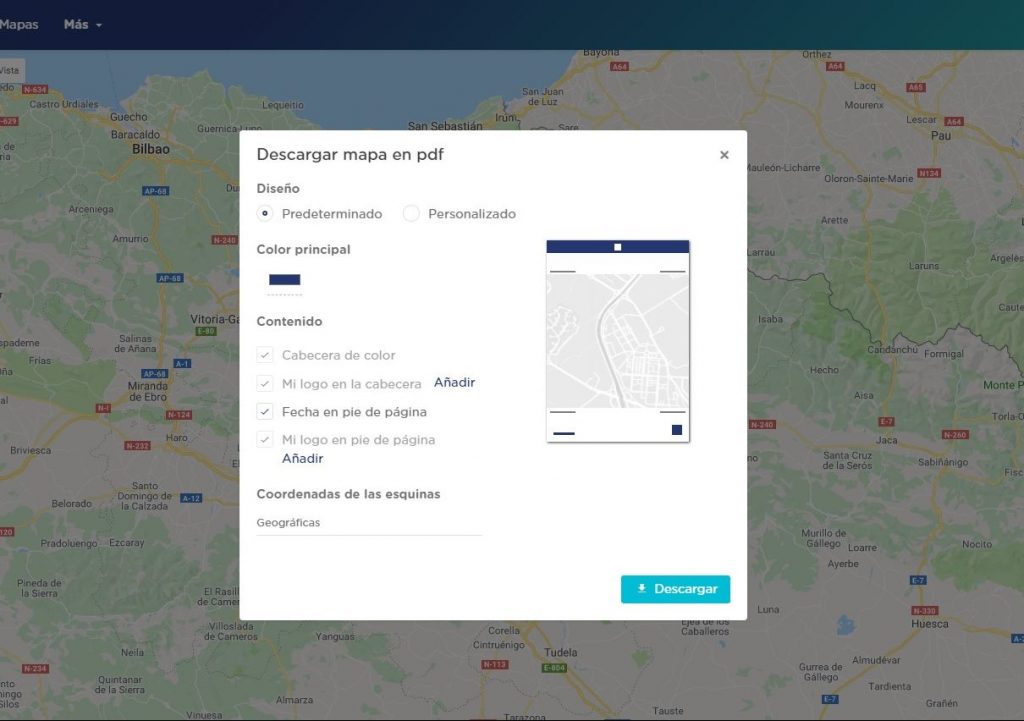
Likewise, we can directly print the map view by clicking on the printer button in the same menu.
User plans
Finally, it should be noted that most Goolzoom tools like PRO Cadastre are not free. Beyond the 15-day trial period, Goolzoom functionalities such as Data, Real Estate and PRO Cadastre are subject to contracting a payment plan and registering as a user.
Read More


