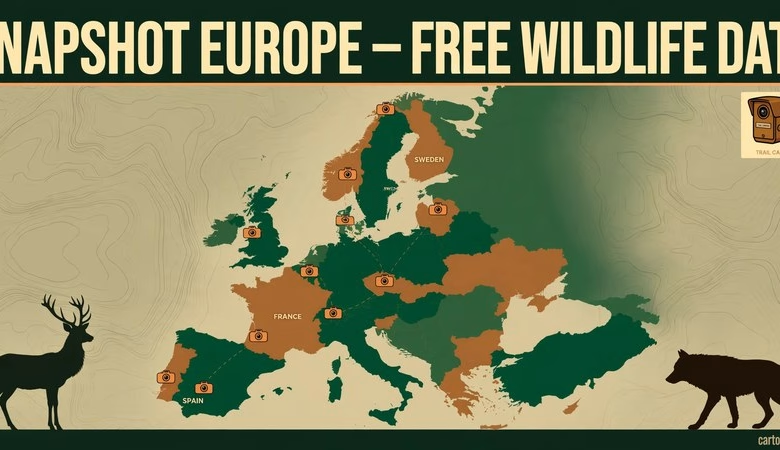
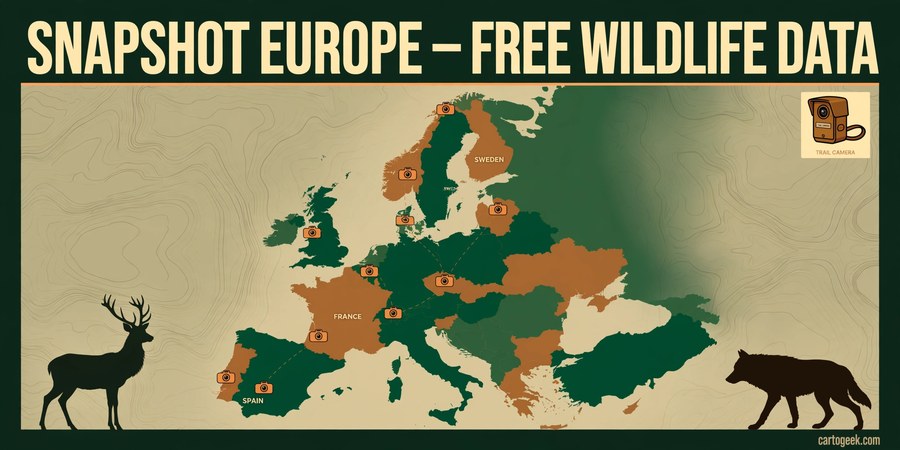
The Snapshot Europe dataset is now free to download — around 100,000 observations of mammals and birds from more than 1,000 camera locations in 22 European countries. The data paper appeared in the journal Ecology on 5 November 2026, and the Max Planck Institute of Animal Behavior calls it the largest open-access survey of mammals and birds across an entire continent. Every record is free to download and reuse under a Creative Commons CC BY-SA 4.0 licence — just cite the data paper.
More than 160 camera-trap experts from 118 organisations set out cameras across Europe each autumn, from the forests of Sweden to the coastal dunes of Spain. Each camera sat at about knee height and photographed any animal that triggered its infrared sensor — from small rodents to brown bears. The result is a standardised, continent-wide picture of European wildlife that works straight in QGIS or ArcGIS, because every observation carries a location.
Snapshot Europe Dataset Free Download: What’s Inside
The published dataset covers the 2021 and 2022 survey seasons (mid-August to mid-November each year):
| Figure | 2021 | 2022 | Total |
|---|---|---|---|
| Camera locations | 1,198 | 967 | ~1,000+ per year |
| Survey arrays | 81 | 55 | — |
| Countries | 22 | 23 | 22–23 |
| Camera-trap days | 49,033 | 41,197 | 90,230 |
The final dataset holds 94,441 observations of 63 mammal species and 5,024 detections of 78 bird species — roughly 100,000 observations in total. All photographs were uploaded to Wildlife Insights, where a built-in AI model suggested the species in each image and a human collaborator checked and approved every label before the data were released.
Most frequently detected species: red deer first, followed closely by roe deer, then wild boar, red fox and European rabbit. Belgium recorded the highest number of daily observations — European rabbits photographed up to 10 times a day — while Parco Nazionale Casentino in Italy had the highest diversity, with 15 species documented, from red deer and badgers to wolves and martens. The northernmost records were moose in the forests of Svartberget, Sweden; at the southern end, red deer were photographed on the coastal dunes of Doñana National Park in Spain.
The survey also tracks species on the move: northern raccoons — originally imported from North America in the 1920s for fur farming — were spotted in Germany, Italy and the Czech Republic, and wolves are rebounding from the brink of extinction in several countries.
Who Is This Dataset For?
- GIS analysts and spatial ecologists mapping species distribution, habitat use and human disturbance across Europe at a continental scale.
- Wildlife researchers and conservation managers who need standardised, comparable camera-trap data across national borders instead of scattered national datasets.
- Students and teachers looking for a real, citable open dataset for coursework, theses or classroom mapping exercises in QGIS.
- Remote sensing and biodiversity analysts combining species occurrence points with land cover, elevation or habitat layers for species distribution modelling.
- Data journalists and map makers who want a verified, headline-ready European wildlife dataset with a strong story behind it.
How to Download the Snapshot Europe Data
- Open the data paper: go to the open-access paper in Ecology (link in the download section below, DOI 10.1002/ecy.70516). No payment is needed — the article is open access.
- Download the data file: the data and metadata are available as Supporting Information (Data S1) attached to the paper, and in Edmond, the Max Planck Society’s open research data repository, under DOI 10.17617/3.7YLWMU.
- Browse the original images: the camera-trap photographs are published on Wildlife Insights — Snapshot Europe 2021 and Snapshot Europe 2022 — where you can explore them by project.
- Open the data in QGIS: load the observation table as a delimited-text layer using its latitude and longitude columns, then style by species to map where each animal was recorded.
- Credit the source: the data are shared under CC BY-SA 4.0, so cite the data paper (Iannarilli et al., 2026, Ecology) in any map, report or publication that uses them.
- Watch for more data: the team is compiling the 2023–2025 survey results now and will publish them the same way, so the same links are worth checking again.
Opening the Data in QGIS
- Download the dataset from Edmond (DOI 10.17617/3.7YLWMU) or the paper’s Supporting Information and unzip it.
- In QGIS, use Layer → Add Layer → Add Delimited Text Layer and point it at the observations file, choosing the latitude and longitude columns as the X and Y fields.
- Use categorised styling on the species field to colour each species differently, or filter the layer to one species — for example red deer — to map its distribution across Europe.
- Join or overlay the points with your own layers — land cover, protected areas, elevation or road networks — to study habitat use or human disturbance around each camera site. Pair the points with elevation from our free DEM download sources for terrain context.
- Use the camera-trap days per location to calculate detection rates (observations per trap day), which makes fair comparisons between countries and sites possible.
If QGIS is new to you, our QGIS tutorial for beginners walks through the full setup, from a blank screen to a finished map in about 30 minutes.
Download Links
Official links only — no mirrors:
- Data paper in Ecology (open access, with Supporting Information Data S1): esajournals.onlinelibrary.wiley.com — Snapshot Europe 2021–2022
- Dataset in Edmond, the Max Planck Open Research Data Repository (DOI): doi.org/10.17617/3.7YLWMU — Edmond dataset record
- Camera-trap images on Wildlife Insights — Snapshot Europe 2021: n2t.net — Snapshot Europe 2021 images
- Camera-trap images on Wildlife Insights — Snapshot Europe 2022: n2t.net — Snapshot Europe 2022 images
- Press release (Max Planck Society / phys.org, 6 November 2026): phys.org — Largest dataset to date on wildlife in Europe
Download Snapshot Europe Dataset — Edmond (Official)
Frequently asked questions
Is the Snapshot Europe dataset really free?
Yes. The data and metadata are free to download from the open-access paper’s Supporting Information and from the Edmond repository, and the images are publicly available on Wildlife Insights. Reuse is under CC BY-SA 4.0 — free for any purpose, including commercial use, as long as you credit the source and share adapted versions under the same licence.
How many animals and locations does the dataset cover?
About 100,000 observations in total: 94,441 mammal observations covering 63 species and 5,024 bird detections covering 78 species, from 1,198 camera locations in 2021 and 967 in 2022, across 22–23 European countries and 90,230 camera-trap days.
Which species was detected most often?
Red deer was the most frequently detected species, followed closely by roe deer. Wild boar, red fox and European rabbit were also among the most common. Belgium had the highest daily observation rate, and Casentino National Park in Italy had the highest species diversity with 15 species.
Can I open the data in QGIS?
Yes. The observations carry geographic coordinates, so they load directly in QGIS as a delimited-text layer. From there you can style by species, filter by country or site, and overlay the points on land cover, elevation or protected-area layers.
Do I need an account to download the data?
No. The dataset downloads from Edmond and from the paper’s Supporting Information with no account. The photographs are published on Wildlife Insights under public project links, so you can browse them without signing in.
Will more Snapshot Europe data be released?
Yes. The team is compiling the results from the 2023, 2024 and 2025 surveys now and plans to publish them the same way. Snapshot Europe has also inspired similar programmes — Snapshot Brazil and Snapshot Chile started in 2025, and Snapshot Global now applies the same protocol worldwide.
Snapshot Europe is the rare dataset that is both huge and immediately usable: 100,000 real wildlife observations, standardised across 22 countries, free under an open licence, and ready to map in QGIS today. Download it from Edmond, open it as a delimited-text layer, and make your first European wildlife map — then check back when the 2023–2025 data lands.
Related posts: Free DEM Download Sources · Free GIS Data Download Sites · QGIS 4.2 Free Download · QGIS Tutorial for Beginners
Disclosure: Some links on this page are affiliate links. If you buy a book through them, CartoGeek may earn a small commission at no extra cost to you. This helps keep our GIS guides free for students. Thank you for your support!
Recommended GIS Learning Books
Learn QGIS: Techniques for Efficient Spatial Analysis (5th Edition)
by Eugenia Sarafova, Ivan Ivanov, Andrew Cutts, Anita Graser
The most current beginner-to-intermediate QGIS book, covering spatial analysis, cartography, field data collection and earth observation workflows with real-world examples. Written with input from Anita Graser, a well-known QGIS community figure, it walks readers from first install to confident analysis.
Pros:
- Up to date with recent QGIS versions
- Hands-on, exercise-driven teaching style
- Covers modern topics like GenAI tools and mobile data collection
Cons:
- Moves fast for absolute beginners with zero GIS background
- Some advanced chapters assume basic statistics knowledge
GIS Tutorial for ArcGIS Pro 3.4 (Esri Press)
by Wilpen L. Gorr, Kristen S. Kurland
A classroom-tested ArcGIS Pro workbook by two Carnegie Mellon instructors, with hands-on exercises and homework assignments that build real problem-solving skills. Written for both university courses and self-learners who want a rigorous primer.
Pros:
- Academic rigor — used in real university curricula
- Exercises reinforce each concept
- Instructor resources available for teachers
Cons:
- Denser and more demanding than casual guides
- Best paired with an instructor or study group
Learning Geospatial Analysis with Python (3rd Edition)
by Joel Lawhead
A systematic guide to GIS and remote sensing analysis with Python, covering geodatabases, raster data, PostGIS, QGIS integration and workflow automation. Readers build real analytical skills, from thematic mapping to flood modeling.
Pros:
- Bridges GIS and Python — the highest-demand skill combo
- Practical projects, not just theory
- Covers the open-source stack (GeoPandas-style workflows, PostGIS, QGIS)
Cons:
- Requires basic Python knowledge first
- Some library versions have moved on since publication